In Europe, the profile of players in first division football teams greatly varies from one country to another. This article highlights the existence of functional demographic hierarchies between leagues of differing economic levels.
Methodology
The demographic analysis of teams of the principal European championships is based on the census carried out since 2009 by the CIES Football Observatory on the 1st of October of each year. In 2012, the study covered 473 clubs, 31 leagues and 11,631 footballers. An excerpt of the Demographic Study 2013 is available here (http://www.football-observatory.com/-Publications,18-). To be taken into account, a footballer must have played at least one match since the start of the season or, if not the case, he must have played matches in adult championships during each of the two preceding seasons.
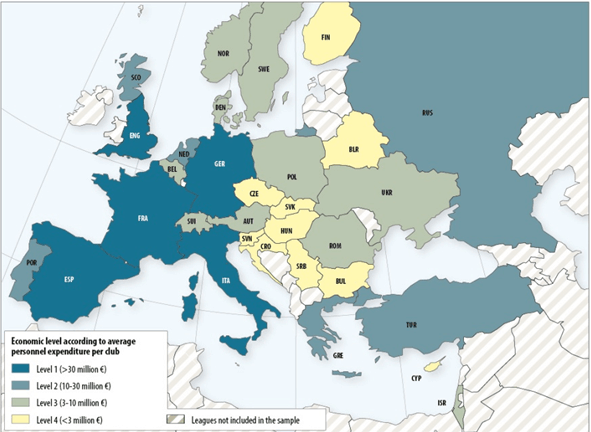
In order to determine the economic level of the championships covered by the census, we referred to the statistics on the average budget for personnel expenses published by UEFA in their 2012 Benchmarking Report (for fiscal year 2010). These figures reflect quite accurately the differences in average salaries earned by players from one country to another. On this basis, the 31 leagues included in the football analysis and predictions were divided into four categories.
The first, often referred to as the “Big Five”, comprises the five major championships (England, Italy, Spain, Germany and France) where the annual budget for salaries per club is on average over 35 million euros. The other categories cover leagues where the figure for salaries per club is between 10 and 35 million euros (Russia, Turkey, Holland, Portugal, Scotland and Greece), between 3 and 10 million (Switzerland, Ukraine, Austria, Belgium, Denmark, Norway, Poland, Sweden, Romania and Israel) and less than 3 million (Czech Republic, Croatia, Slovakia, Cyprus, Belarus, Serbia, Bulgaria, Hungary, Finland and Slovenia).
Figure 1 The economic level of the 31 leagues covered by the 2012 census
The paper analyses the differences in the demographic features of players per league economic category according to the following indicators: average age, percentage of club-trained footballers, percentage of expatriate players and percentage of full internationals.
Age gaps
The average age is greatest in the richest leagues (26.5 years of age) and diminishes progressively going down the rankings for a figure of 25.6 years of age for the bottom level. The squads of the biggest championships have more experienced players. These are all the more sought after as experience is one of the key factors for performance.You can also read this post about best football analysis.
Figure 2 Average age according to league economic level

Conversely, young players are less numerous in the “Big Five”: only 16% of them are under 22 compared to 24% in the fourth economic level. The progressive increase in the percentage of young players in the less wealthy leagues is accompanied by the need for players to progress by stages in the football labour market. It also reflects the strategies adopted by clubs with average financial means, for which young players represent a source of cheap labour whose development offers financial possibilities in the case of transfer to wealthier clubs.
Figure 3 Percentage of under-22 players according to league economic level
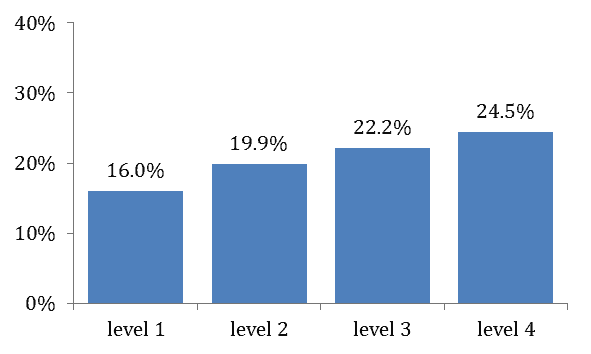
This logic is particularly evident in Slovenia and Croatia, where players are on average 23.7 and 24.1 years old, which makes them the two youngest leagues of the census. With this in mind, among championships with modest financial means, Cyprus and its 28.3 year old players (of which only 10% are under-22), is the exception. Generally speaking, a functional complementarity becomes apparent between wealthy clubs seeking experience and others with more limited financial resources where footballers have sufficient playing time to fully develop their talents.
Club-trained players’ employment
For teams whose championships are of limited financial means, the setting up of a sporting and economic model based on the value-added development of young talents depends strongly on their ability to train them. The poorest leagues have indeed more footballers from their youth academies (27%) than the better off teams (17%) and those belonging to the second economic category (15%). According to UEFA-defined criteria, to be considered as club-trained, a player must have spent three whole seasons at the club between the ages of 15 and 21
Figure 4 Percentage of club-trained players according to league economic level
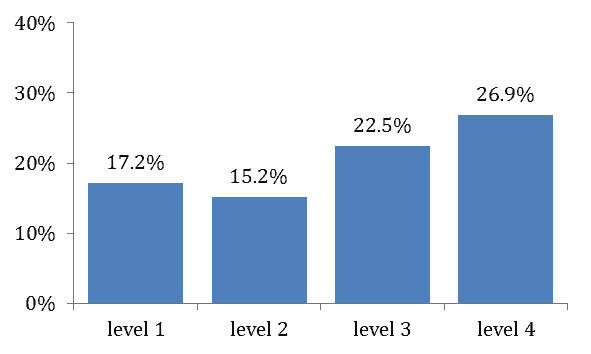
While economic considerations are important, the presence of club-trained players also varies widely between leagues of a similar level. Thus, among championships with modest potential, the use of home-grown footballers is much more common in Slovakia (40%) than in Cyprus (11%) or in Bulgaria (16%). Likewise, in the two first tiers of the economic ranking, the percentage of club-trained players is particularly low in Turkey (9%), Portugal (9%) and Russia (13%), while it is greater or equal to the European average in Spain (26%), Holland (22%) and France (21%). These differences reflect the various strategic choices and abilities regarding training according to country.
Economic hierarchies also do not account alone for the differences measured between teams. Indeed, for example, 59% of FC Barcelona players were club-trained compared to 26% for Real Madrid. In England, we go from 40% for Manchester United to 9% for Chelsea. In this case also, differences are due primarily to differing policies regarding integration of players from the training centres into the first team, as well as probable differences in the quality of training given.
However, while club-trained players are generally underrepresented in the best European leagues, many top-level teams are among the highest rankings of those having trained the greatest number taken into account in all of the European championships. This result shows that the clubs with considerable financial means at their disposal contribute to the training of players that swell the ranks of less well-off teams. The functional link between teams of different economic levels also operates on this level.
Table 1 Teams having trained the greatest number of footballers playing in top division championships
| In other clubs | In the club | Total | |
|---|---|---|---|
| 1. AFC Ajax | 53 | 16 | 69 |
| 2. FK Partizan | 47 | 13 | 60 |
| 3. HNK Hajduk Split | 39 | 16 | 55 |
| 4. FC Barcelona | 36 | 17 | 53 |
| 5. Sporting Clube de Portugal | 43 | 6 | 49 |
| . MTK Budapest | 33 | 16 | 49 |
| 7. AC Sparta Praha | 38 | 9 | 47 |
| 8. Feyenoord Rotterdam | 32 | 13 | 45 |
| 9. FC Dynamo Kyiv | 36 | 8 | 44 |
| 10. Real Madrid CF | 37 | 6 | 43 |
| 11. FC Shakhtar Donetsk | 36 | 5 | 41 |
| . SK Slavia Praha | 32 | 9 | 41 |
| 13. FC Porto | 35 | 4 | 39 |
| 14. GNK Dinamo Zagreb | 31 | 6 | 37 |
| . FK Dinamo Minsk | 30 | 7 | 37 |
| . FC Nitra | 17 | 20 | 37 |
| 17. Manchester United FC | 24 | 12 | 36 |
| . OFK Beograd | 24 | 12 | 36 |
| 19. NK Osijek | 14 | 21 | 35 |
| 20. PSV Eindhoven | 32 | 2 | 34 |
| . FK Crvena Zvezda | 30 | 4 | 34 |
| . PFC Levski Sofia | 30 | 4 | 34 |
| . Olympique Lyonnais | 24 | 10 | 34 |
The presence of expatriate players
The international recruitment of players was for many years hampered by the quotas limiting the number of foreigners. The Bosman ruling decreed by the European Court of Justice in December 1995 changed the rules for clubs of European Community member countries or those having signed free movement of people agreements with the EU. Communitarian players were effectively no longer bound by quotas, and, at the same time, numerous leagues liberalized the presence of non-communitarian footballers. For the Big Five, the percentage of players imported from abroad increased from 19% to 43% between 1995 and 2012.
More generally, on the 1st October 2012, the presence of expatriates in leagues covered by the census was over one-third (36%) of squads. A player is considered as expatriate when he has grown up outside of the national association of the club where he plays which he joined following recruitment linked to football. The proportion of expatriate footballers is higher in richest championships than those where clubs have comparatively limited means available. Only one-quarter (27%) of players of leagues in the fourth echelon were expatriates.
Figure 5 Proportion of expatriates and league economic level
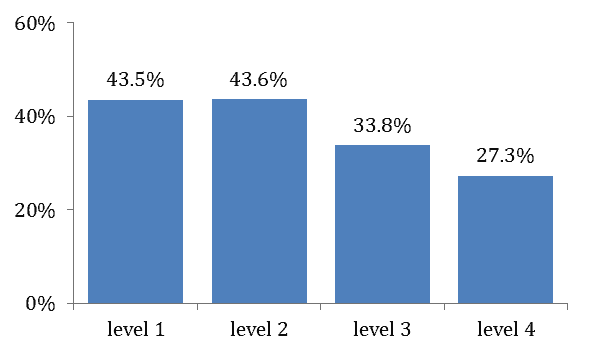
Though the economic aspect remains fundamental in understanding recruitment policies, the use of expatriates is also to be understood in relation to effectiveness of national training structures. For example, in France and in Holland, two countries with a solid tradition of training, the level of expatriates is low in comparison to the economic status of national leagues (27% and 32%). On the other hand, Cypriot clubs employ a very high proportion of imported players compared to the existing workforce (74%).
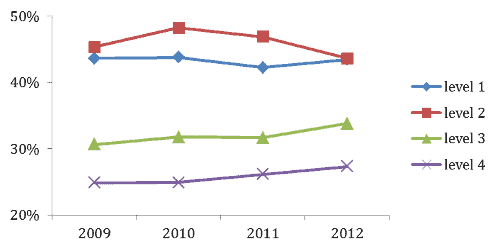
Though significant for the 31 leagues, the correlation between imported players and available resources is falling steadily. Over the last four seasons, the correlation coefficient (R2) between the proportion of expatriates and average personnel expenditure per league decreased from 36% to 25%. Today, the internationalization of the football players’ market is indeed strengthened principally in leagues of the third and fourth economic levels, where the proportion of expatriates increased from 31 to 34% and 25 to 27% respectively, between 2009 and 2012.
Figure 6 Evolution in the proportion of expatriates, according to league economic level
The very uneven presence of full internationals
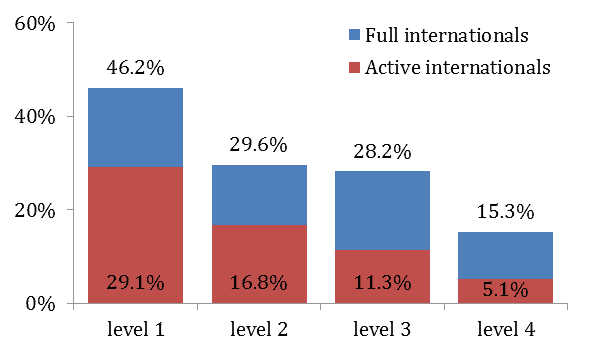
More so than the proportion of expatriates, the discrimination between clubs and leagues now occurs in relation to the presence of players having already been selected for a national A-team during their career. Among the criteria examined so far, the percentage of players with the benefit of international experience is by far that which for the differences between the economic levels of the championships are the greatest. The proportion of full internationals drops from 46% for Big Five clubs to 15% for fourth echelon leagues. This result brings to light a double causal link: the importance of the status of internationals to gain access to the top leagues and the importance of playing in the major championships so as to keep one’s place in the national team. Find more evidence from the FIFA World Cup and the UEFA European Championship.
The differences between championships are even more apparent if we only take active internationals into account. Active internationals are those who have played at least one match with the national team during the year of the census. Indeed, they are six times more numerous in the top level of the economic rankings (29%) than in the bottom one (5%).
Figure 7 Proportion of active internationals according to league economic level
At league level, the percentage of active internationals varies from 42% in England to only 1% in Slovenia. From this point of view, the dynamic observed in Russia is particularly interesting. The presence of this category of footballers has strongly increased over the past few years, from 11% in 2009 to 30% in 2012. This rise reflects the growing economic means of Russian clubs which are becoming more serious competitors for the major European championships for the recruitment of the most sought after players and coaches.
The ability of clubs from the most prestigious leagues to recruit footballers with international experience is a major criterion for success. The top teams of European football all have a large number in their squad. With 24 internationals out of a squad of 26, Manchester City could even field two complete teams made up of internationals. At the other end of the scale, 26 clubs out of 473 taken into account have no internationals. Two-thirds of them are part of championships in the fourth echelon.
Table 2 Teams with the most internationals
| Full internationals | Active internationals | |
|---|---|---|
| 1. Manchester City FC (ENG) | 24 | 19 |
| . Milan AC (ITA) | 24 | 14 |
| . Galatasaray SK (TUR) | 24 | 13 |
| 4. Manchester United FC (ENG) | 23 | 16 |
| 5. Arsenal FC (ENG) | 22 | 17 |
| . FC Zenit St Petersburg (RUS) | 22 | 17 |
| . VfL Wolfsburg (GER) | 22 | 10 |
| 8. FC Dnipro Dnipropetrovsk (UKR) | 21 | 13 |
| . Internazionale Milano FC (ITA) | 21 | 10 |
| 10. PFC CSKA Moskva (RUS) | 20 | 17 |
| . Chelsea FC (ENG) | 20 | 16 |
| . Juventus FC (ITA) | 20 | 16 |
| . Celtic FC (SCO) | 20 | 15 |
| . Liverpool FC (ENG) | 20 | 14 |
| . Fenerbahçe SK (TUR) | 20 | 13 |
| . Tottenham Hotspur FC (ENG) | 20 | 12 |
| . SS Lazio (ITA) | 20 | 5 |
| 18. FC Barcelona (ESP) | 19 | 18 |
| . FC Bayern München (GER) | 19 | 17 |
| . West Bromwich Albion FC (ENG) | 19 | 15 |
| . FC Dynamo Kyiv (UKR) | 19 | 15 |
| . Fulham FC (ENG) | 19 | 13 |
| . Paris St-Germain FC (FRA) | 19 | 13 |
| . FC Shakhtar Donetsk (UKR) | 19 | 12 |
Conclusion
The Russian example shows to what extent the economic polarisation of European football contributes to the segmentation of the labour market and modifies the balance of competitions. For a majority of clubs, the only viable goal is to train and add value to young players and transfer them to wealthier clubs, if possible, for money. In fact, many teams with limited resources are in a chronic situation of financial and managerial instability that goes against the setting up of long-term training policies and giving young talent their chance. This instability is reinforced by intermediaries with increasing influence whose personal gain is the sale and purchase of players and who rely on the networks associated with coaches and heads of clubs. If you want to discover more about 2018 World Cup Russia, hop over here.
The collusion between the actors in charge of transfers in clubs and intermediaries thus favor lucrative short-term strategies, seeking to multiply them to the detriment the training and launching of local players. The situation has reached its climax when it entails the appropriation of transfer rights by third-party investors. By pocketing a major part of the pay-out in case of resale, the latter end up acquiring a dominant position that enables them to render clubs dependent. Often presented as a short-term liquidity solution, the handover of player rights to third parties can, in the long-term, be a decisive step on the road to bankruptcy.

