One of the most sustained patterns in sport, likely throughout its organised existence, is the home advantage. Pair two completely evenly matched teams together, and the team playing in their own surroundings will win more than 50% of the time. The London Olympic and Paralympic Games gave a graphic example of this, with Great Britain breaking numerous records in terms of medals won. Of course there are other factors that could help explain GB’s performance in the 2012 games, but the fact athletes performed in familiar surroundings undoubtedly contributed to their improved performance.
Home advantage in football
Figure 1 plots the extent of home advantage over a very long period of time in European football; starting in the late 1800s for British football, the ratio of home to away wins is comfortably above unity throughout the sample, and while it does appear that home advantage has tapered off somewhat since the early 1990s, the ratio remains nearer to two than one.
Causes of home advantage
Economists have naturally attempted to understand more about this. Some explanations have been ruled out through the passage of time; for example, it cannot be in this age of comfortable, cheap travel, that travel costs contribute to this home advantage, since the home advantage remains pertinent. Furthermore, the 1970s oil price spikes do not have an obviously noticeable effect in Figure 1 – the German increase in home advantage starts in the mid-1960s, there is no clear mean effect in England, and in Scotland home advantage keeps declining gently over this period as it does throughout the post-war period.
As detailed data becomes more readily available, and methods for understanding it keep improving, it is hoped that eventually more light will be shed on the phenomenon of home advantage. One such method was by Nevill et al (2002), who investigated referee decisions by forcing referees to call decisions in a match relayed on a TV both with and without the sound on. With the sound on, hence with the protests of the supporters vocal, referees called more decisions in favour of the home team – so one explanation is the influence of the crowd, although perhaps not in the direction that might have been instinctively appreciated.
The impact of television
In the late 1980s a revolution happened in televised football in England, with the duopoly of BBC and ITV being broken by a new entrant, BSkyB. Quickly the commercial value of sports coverage was realised, with a mushrooming in the prices being paid to televise football. Very quickly what was a rarity became very commonplace indeed – live football on TV.
At round about the same time, the extent of home advantage in the Premier League, England’s top division of football, declined noticeably, in an apparent shift change. To attempt to explain this change, we (Koyama and Reade, 2009) made use of game theory and the principal-agent relationship, where the principal is the supporters for the home team. In English football, while there is generally much greater support for visiting teams in a stadium than is commonplace in North America where distances are much greater, it is almost always the case that the home supporters vastly outnumber visiting supporters.
Previously, we hypothesised, footballers could remain crowd favourites just by working hard in home matches in front of the team’s supporters, whilst they could put in less effort in away matches where they were not being observed, or monitored, by supporters. In the TV age, however, football fans could now monitor their players both home and away, and hence players could no longer shirk in away games and remain a favourite with the fans nor subsequently remain in the team. Hence effort levels by away players increased, resulting in a noticeable decline in home advantage.
We employed a simple regression method to test this monitoring hypothesis: a dummy variable with takes the value 1 after the first non-duopoly TV contract was struck is significant in a regression of home advantage. Home advantage displays a level shift down at this point, and hence we hypothesise that the monitoring mechanism explained above can account for this shift particularly well. We can rule out many other potential mechanisms such as the change to 3 points for a win in the early 1980s, the advent of promotion play-offs in lower divisions as both wrong timing for shift.
Home advantage in-match
A recent, exciting initiative from Manchester City, called MCFCAnalytics, can be used to learn more about home advantage. MCFCAnalytics makes freely available highly detailed data from Opta on all matches in the 2011-12 Premier League season in England. Their lite dataset contains enough information to learn a little more about the nature home advantage via graphical methods.
We look at a range of variables that might help shed some light on why home teams win more often. We look at a number of constituent parts of a football match, grouped into three separate categories: Passing actions, non-pass actions and goal/shot actions. We’ll discuss each in turn.
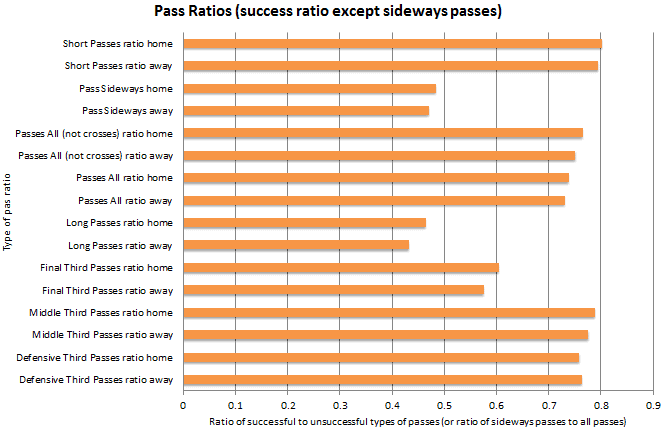
From the above bar chart, we can see the differences between home and away players in terms of passes – we consider a large number of different passes, and we consider ratios rather than absolute numbers. This is because home teams usually do more of many of these actions, yet simply knowing a team does more is not necessarily informative. There are only marginal differences between home and away teams in terms of short passing success ratios, and home teams pass sideways more than away teams (as a ratio of their total passes). When it comes to longer passes, the difference is more distinct, suggesting perhaps that when looking some distance to pick a pass, familiar surroundings and a familiar sized pitch may aid players. The success ratio of passes is indistinguishably different between home and away teams in the defensive and middle thirds of the pitch, but in the attacking third home teams have a noticeably higher success ratio. This could be because away teams tend not to attack with as many supporting players as home teams, giving players in advanced positions fewer options.
When considering non-pass actions, the MCFCAnalytics data allows us to look at tackles, ground duels, aeriel duels (and the combination of the two), as well as dribbles. Looking at the graph above, which plots the success ratios of these kinds of non-pass actions, we note that it is only for dribbles where we see a noticeable difference – home players are more likely to succeed when dribbling with the ball than away players.
Our final chart considers various aspects of shooting and goalscoring. The first line looks at the ratio of shots outside the box to those inside, and we note that home teams appear to shoot more from outside the box, whilst of those shots inside the box, home teams appear to get more on target than away teams – perhaps again indicating that when players look up at their surrounds, this impacts their decision making.
What more could be learnt using the advanced MCFCAnalytics dataset?
With the lite dataset, only so much can be learnt about home advantage, and we are forced to speculate about causal mechanisms. All the results presented could have more than one mechanism that lead to their occurrence. MCFCAnalytics will also be releasing an Advanced dataset which contains much information which might help shed more light on the nature of home advantage. For example, it may be momentum is a factor, and hence looking at particular incidents early in a match (Advanced data has information on the timing of all incidents) may be informative. More fundamentally, if we are able to break down a football match into its individual components, their timing and location, it must be that more can be learnt about the root causes of home advantage. For example, if we speculate that it is familiar surrounds, then we can consider only longer passes into particularly distinctive areas of a stadium.
Conclusions
Arcing back to the hypothesis that Mark Koyama and myself proposed for home advantage, we could compare the effort levels of players in home games vs away games in much more detail: How much ground do players cover between their recorded actions? We anticipate that MCFCAnalytics will breathe new life into many investigations in the economics of sport, yielding many exciting conclusions.